About Course
Course Overview
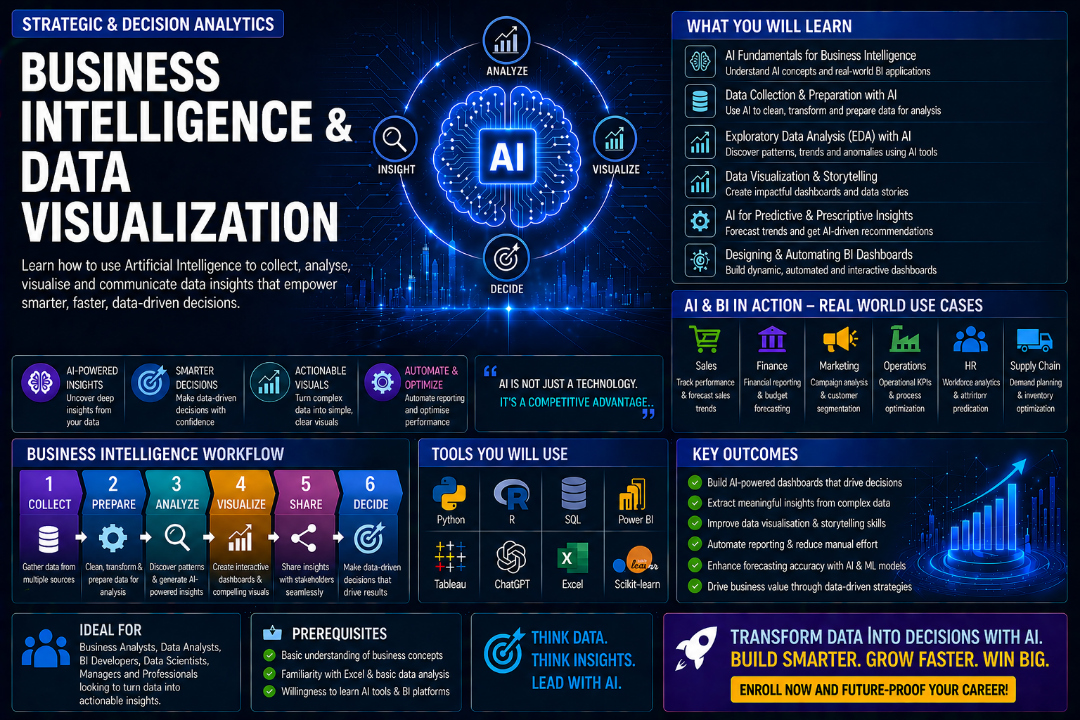
A practical, industry‑focused course that teaches learners how to transform raw data into meaningful insights using BI tools and visual analytics. The course covers data modelling, dashboard design, KPI frameworks, storytelling with data, visual best practices, and decision‑support techniques using platforms such as Power BI, Tableau, and Looker.
Target Audience
-
Business analysts and data analysts
-
Operations, finance, HR, and marketing professionals
-
BI developers and reporting specialists
-
Managers and decision‑makers who rely on dashboards
-
Students or professionals entering analytics or BI roles
Course Outcomes
-
Understand BI concepts, data pipelines, and analytical workflows
-
Build data models and prepare datasets for reporting
-
Design dashboards using visual best practices and KPI frameworks
-
Create interactive charts, drill‑downs, and dynamic visual elements
-
Apply storytelling techniques to communicate insights effectively
-
Evaluate dashboard performance, usability, and decision impact
-
Use BI tools to support operational, financial, and strategic decisions
-
Present insights clearly to stakeholders and leadership teams
Earn a certificate
Add this certificate to your resume to demonstrate your skills & increase your chances of getting noticed.
Student Ratings & Reviews
